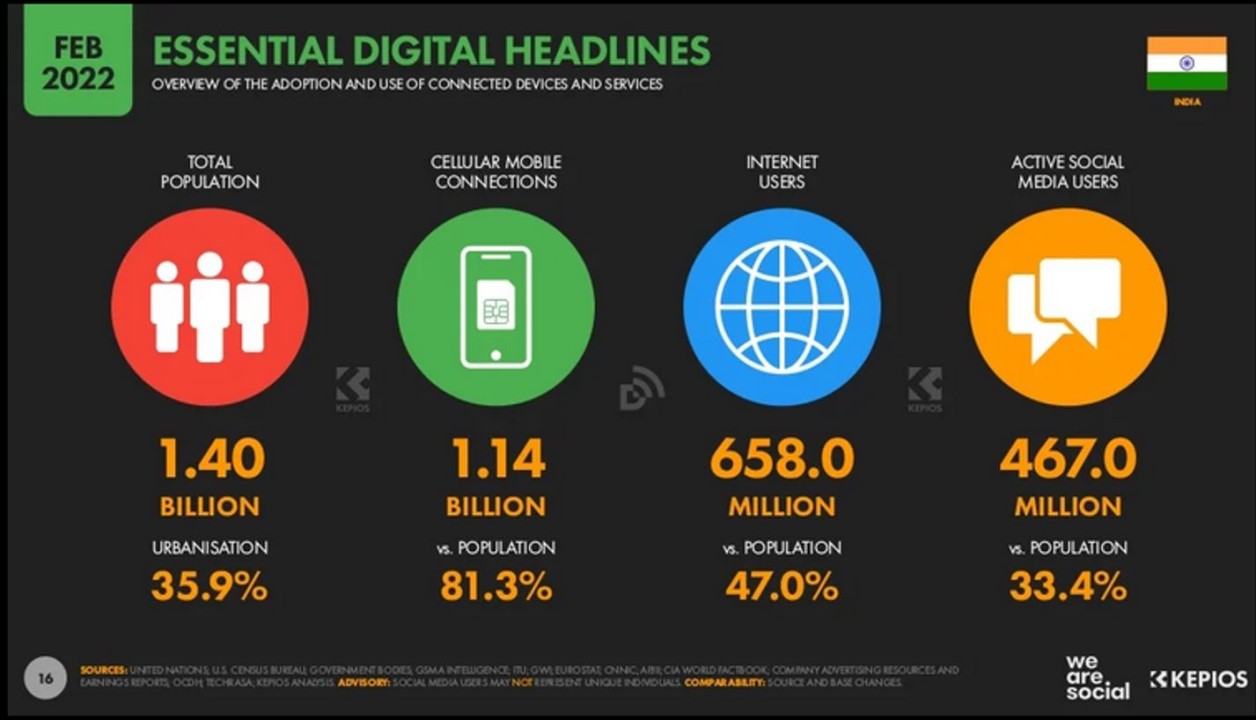
In worldwide internet usage data, China tops with 1 billion+ users, India is second with 658 million, US with 307 mn & Indonesia with 205 mn, according to Statista (Feb ’22). In reality, this data reflects internet connections & not number of users, in the country’s population. Data from GSMA Intelligence shows that there were 1.14 billion cellular mobile connections (81.3% of population) in India at the start of 2022.
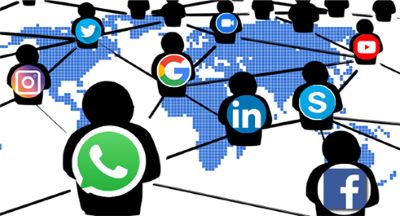
India had the second-highest number of mobile app downloads in the world after China, with over 27 billion downloads coming from the country, beating USA which only clocked 12.2 billion app downloads. There were 467.0 million (33.4% of population) social media users in India in January 2022. Data published in Meta’s advertising resources indicates that Facebook had 329.7 million (23.5% of population) users in India in early 2022, highest in the world. Updates to Google’s advertising resources indicate that YouTube had 467.0 million (33.4% of population) users in India in early 2022. Numbers published in Meta’s advertising tools indicate that Instagram had 230.3 million (16.4% of population) users in India in early 2022. Figures published in LinkedIn’s advertising resources indicate that LinkedIn had 83.00 million “members” (5.9% of population) in India in early 2022. Data published in Snap’s advertising resources indicate that Snapchat had 126.0 million users (9% of population) in India in early 2022. Numbers published in Twitter’s advertising resources indicate that Twitter had 23.60 million users (1.7%) in India in early 2022.
On an average, an Indian internet user spent 7 hrs 19 mts online. Daily online TV/Streaming/videos was 3 hr 11 mts ; Social media daily usage of 2 hrs 3 mts ; Online music/radio was 2 hr 33 mts; Online reading/news text was 2 hrs 15 mts & Gaming was 1 hr 21 mts.
India level internet & social media statistics are widely announced & as developed countries saturate on new internet subscribers, this India data has become a key growth driver for Meta, Alphabet, Twitter & Linked-In. Each of these companies have advertising revenue models linked to their free subscribers, and their self-published data needs a regular review for fake accounts. In India, the internet data source is the government’s TRAI (Telecom Regulatory Authority of India) quarterly report which collates the internet subscriber data from internet/telecom provider inputs. For a geography as vast as India’s 9,389 towns & 600,000 villages, the TRAI report is only available at State & UT level, split by Urban & Rural. Ironically, it is not collated at a District level even though Indian census & governance has each of the 725 Districts, as its focal point. To make matters worse, neither TRAI nor any other government body focuses on the utility of the internet for the diverse linguistic population of India. Creation of local language content is delegated to state governments but not even tracked centrally or at state-level. Global internet data (Internetworldstats.com) however highlights the gap - while 7 Indian languages, Hindi, Bengali, Punjabi, Marathi ,Telugu ,Tamil, Urdu rank in the top 20 most spoken languages in the world, none feature in the top 10 languages used on the Internet ( English, Chinese, Spanish, Arabic, Portuguese, Indonesian/Malaysian, French , Japanese , Russian, German in that order).
Based on the state level urban/rural TRAI data, and looking up FB’s user base on its advertising module, an analysis of India’s biggest towns (based on census data of population, population growth rate, & literacy rates), its apparent that FB user base in each city is inflated by 2 times (Gwalior) to 8 times (Aurangabad) the literate population (Aged -15 to 65 years) of the largest 35 cities. Likewise, TRAI state-level data, when apportioned to these largest 35 cities indicates that just 11 of them have an internet subscriber base, less than the city’s total population & 24 cities now have more internet subscribers than their respective population. Infact , Hyderabad has nearly double the population. Its apparent that TRAI state urban internet user numbers & FB city-wise user base numbers are much overstated & TRAI doesn’t appear to be doing any validation with population data.
The State & UT internet penetration vs Population vs Language ( Mother Tongue & English) vs Urbanisation vs GDP, is an important measure expected to highlight the correlation between internet usage, education & economic growth. However, the output reveals no such trend. Again the TRAI urban internet data volumes seem overstated vis-à-vis population. The 7 North East Indian states have urban internet penetration of 558% of their respective population, Himachal Pradesh has 302% & another 9 states have already reached 100%+ urban internet penetration. In the rest i.e. the 11 Indian states which have yet to reach 100% urban population on internet, M.P. & Chhattisgarh at 52%, and Odisha & Punjab at 54%, have the lowest. The TRAI data on internet spread in India appears to have no correlation with language/Mother Tongue nor economic impact of a state. Rate of urbanization of states does have an obvious direct correlation with internet growth i.e. urban higher than rural.
References –
https://datareportal.com/reports/digital-2022-india
https://inc42.com/buzz/indias-internet-data-usage-shoots-up-to-14-1-gb-per-month/
 Intelligent Insights...