The total urban population in India as per Census 2011 was approx. 377 million constituting 31.16% of the total population. This is lesser than the world average urbanization rate of approx. 51%. Of the 4037 world cities with more than 100,000 population, India has 485. Within this, India has 46 Cities (of the World's 512 cities) with a Million+ population. These include 5 Indian Mega-Cities (Urban agglomerations, added in) in the World's 34 Mega-Cities, each with 10 Million+ population.
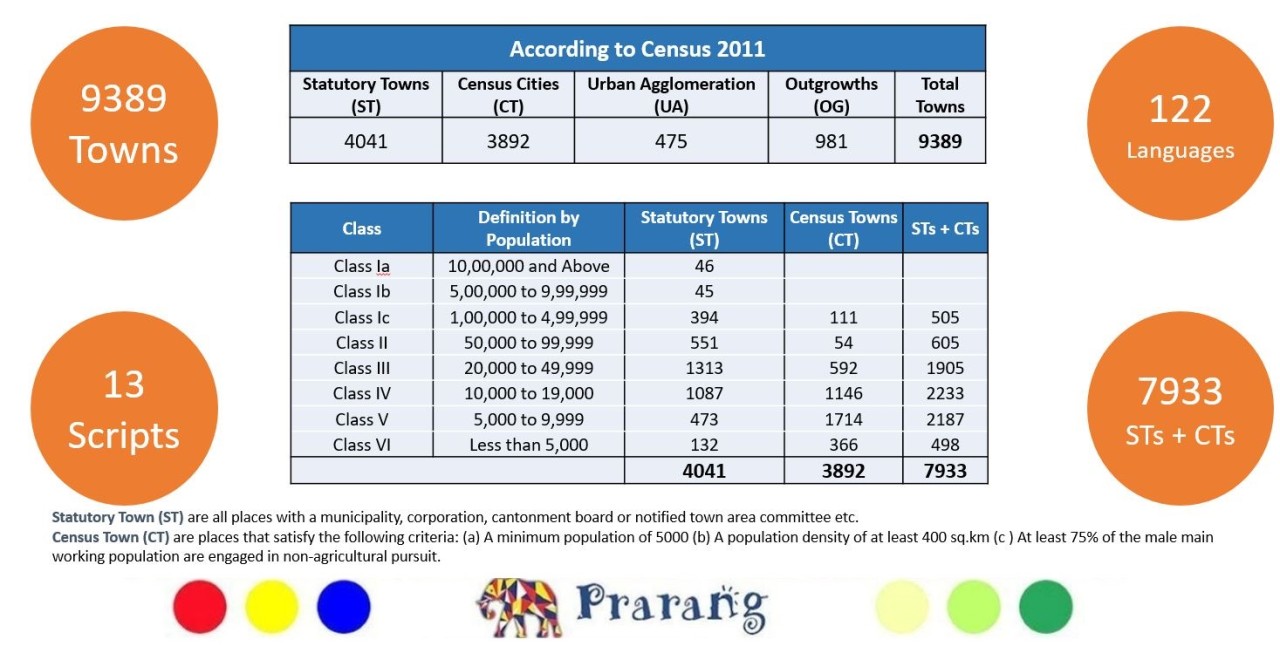
India has 9,389 towns - 7933 are ST & CT (Statutory towns with Municipalities & Census Towns with 5K+ population & 75%+ Non-Agri male employment), 475 UA ( Urban Agglomerations) & 985 OG (Outgrowths). Politically, the country has a capital , 28 State Capitals & 8 Union Territories, now in 2022. But from a management perspective, India has 742 District Headquarter towns ( up from 640 in Census 2011), through which all other towns & 649,481 villages are administered. Historically, the District is the focus of data collection (census) in India & its the fulcrum of governance for all towns & villages within its geographic boundaries. The District Headquarter City ( An area with substantial inhabitation & a systematic scale of life ) & the related District ( A physically defined land area with its own biological environment) by definition, together form a bio-regional area with a focus on both Culture & Nature. The District Headquarter (HQ) thus corresponds well to the ideal of bio-regional development, as defined by the father of urban-planning, Patrick Geddes. The interdisciplinary approach of urban-planning Geddes modeled, centered on - Work, Place, People - ‘Place’ implied geographical locality which presents the environmental pressures (needs) and the possibilities (resources) and in turn determines the nature of the work. ‘Work’, determines the organization of the family which is the biological unit of 'People'/society.
An analysis of India's 9,389 towns reveals that 1,201 had over 100,000 population in 2011. Most of these are one of the 742 District Headquarter & Union Territory towns of 2022. Next are the 4,183 towns with a population between 10K & 100K - most of these are one of the 5,564 Sub-district (Tehsil/Taluk/Mandal) head-quarters of India, which manage the villages in their respective area. From an urbanization perspective, the 742 District HQ towns should be the focus. Standardization of services ( primary healthcare, education, infrastructure) in the DHQs can achieve uniform growth across a vast & diverse geography. Analyzing 742 DHQ diversity on spoken languages & unity of written scripts, what emerges is that there are only 505 towns in India with a single language pool of 30,000+ people. Of course, since most of the Mega-Cities with several million population have 10+ language pools of 30K+ population, these 505 towns have an aggregate of 970 " Script Pools" (of 30K+ people).
In India's top 15 largest cities, it is noteworthy that Mumbai ( Marathi 35%) & Bangalore (Kannada 42%) are the most multilingual & Ghaziabad (Hindi 95%) & Vishakhapatnam (Telugu 93%), are the least. What is more interesting, is the list of India's 40 most multilingual towns i.e. those which have the most representation of the 121 Mother Tongues (MTs), regardless of the size. The Mega-Cities of Delhi, Bangalore & Mumbai have the highest 100+ MTs & 18 of India's 28 State Capitals feature in the list of 40 most multilingual towns, primarily because of the nature of government job creation. Pimpri(Pune), Pune, Navi-Mumbai, Guwahati, Gurgaon, NDMC (Delhi) are six big towns which feature in the list, because of their size ( & related industrial job creation). But it is the other 16 non-state-capital & small but highly multilingual towns of India, which are particularly noteworthy - 9 in Nagaland ( Dimapur, Mokokehung, Chumukedima, Medziphema, Tuensang, Phek, Zunheboto, Kuda,Naginimora), 2 in Meghalaya ( Nongthymmai, Madanriting), 2 in Arunachal Pradesh (Jairampur, Naharlagun), 1 in Bengal ( Uttar Satali), 1 in Assam (Haflong) & 1 in Madhya Pradesh ( Dhana). Dimapur in Nagaland with 122K population is India's 4th most multilingual town with an astonishing 94 MT speakers, Madanriting in Meghalaya with just 29K population is the 8th most multilingual town with 81 MTs & Nongthymmai in Meghalaya with 38K population is the 12th most multilingual with 75 MTs. In Arunachal Pradesh, Jairampur with a mere 7K people has 61 MTs. One small town in North Bengal ( Uttar Satali), in proximity to North-East tribes, with 18K population has 67 MTs. Even a small town of Dhana, near Sagar in Madhya Pradesh, with 10K population, had a surprising mix of 57 MTs in 2011. Multilingual locations are lead-indicators of urbanisation success.
What drives a shift away from agrarian/rural living to Urbanisation ? The economic upside of town jobs, of course. But another expected aspect of the migrant is the stability of contractual monthly earning, instead of the seasonality & weather dependence of agriculture earning. In India though, most employment (95%) is informal i.e. contract-less & thus, unstable too. Yet, with free movement of labour between 28 different states, the vast difference in GDP per capita, is still a driving factor for work related migration. Last year's government GDP data ( MOSPI) indicates India's GDP per capita is Rs 134K, annually. While 8 states are below the country average, 4 are much more economically weak - Bihar @ Rs 51K, Jharkhand @ Rs 87K, Manipur @ Rs 92K & U.P. @ Rs 74K. These 4 states are 28% of the Indian population & collectively contribute just 12.6% of the country's GDP, thus leading to the biggest migrant worker populations in other states. India's highest GDP per capita states are Goa @ Rs 520K, Delhi @ Rs 415K, Sikkim @ Rs 418K & Haryana @ Rs 272K. Of the larger states, Tamil Nad @249K, Telangana @ 250K, Karnataka @ 246K, Kerela @ 245K, collectively contribute nearly 25% of India's GDP & have just 15.5% of India's population. Maharashtra @ Rs 230K & Gujarat @ 244K are the other two big states, attractive for migrants. Together these two states contribute 21.8% of India's GDP & have 14.3% of India's population.
State-level GDP & related state-level migration are just indicators. Historical migrations already reflect in the multilingualism report of the last census - For eg. - how many tamil MTs know bengali vis-a-vis how many Bengali MTs know Tamil, as a percentage of respective MT population. From a proper planning perspective though, it is City to City ( or District to District, in India) GDP & related migration, which needs to be analyzed, to understand cause & effect of urbanisation. However, data on City GDP is suspect/inconsistent & data on migration is just not monitored. An attempt at collating GDP data of India's largest cities highlights the inequities & does explain why India's mega-cities are rapidly growing into the world's largest cities, exhausting their own geography's natural resources & becoming unhealthy & polluted. Mumbai GDP per capita is Rs 926K & Pune GDP per capita is Rs 711K but Maharashtra State is Rs 230K & while big Bihar state is just Rs 51K, its capital of Patna has a GDP per capita of Rs 523K.
While inter-city/district GDP per capita differences need to be tracked for 725 DHQs of India, the first step is to take note & bring equity in the inter-city/district GDP per capita, within each of the 28 states, especially the big ones. Uttar Pradesh is a sixth of Indian population & has 75 districts with a state GDP per capita of Rs 74,141 ( MOSPI, 2020). District-level GDP per capita was last shared in detail when it was Rs 55,224 ( MOSPI 2016-17). The richest districts in GDP per capita were - NOIDA @ Rs 676K, Meerut @ Rs 117K & Lucknow @ Rs 106K , while the poorest districts of Chitrakoot, Shravasti & Mahoba were approx half of the State average, on a per capita basis.
The government focus on urban development in India, is the 7 year old - Smart Cities - project. Technology-lead economic & infrastructure monitoring systems development of 98 selected cities, is the goal. However the selection of the 98 cities is left to the political discretion of the 28 state governments & 8 UTs, each of whom have been given a fixed quota of cities. As such, Smart Cities have NOT been selected centrally on the basis of any India-level analysis on the GDP per capita, Employment/Work structure, Multilingual mix, Natural Resource availability etc. However, it is worth noting that all 98 Smart Cities selected thus far, are one of India's 725 District Headquarter towns. The economic emphasis thus in each DHQ is a Nature-Culture mix of Urban-Rural, with multiple towns & villages of the district reporting into the DHQ. The real benefits of this Smart Cities investment will only flow when all 725 District HQs are seen as part of one integrated urbanisation plan which monitors & leads to formal job creation. A city multilingualism mix resultant outcome should be celebrated & encouraged. To begin with, the 16 small & hidden most multilingual towns ( in the list of Top 40, of 7,933 towns) should be analysed & then supported for further growth.They are already smart.
 Intelligent Insights...


